Introduction – Prometheus Node Exporter on Raspberry Pi
What does this tutorial cover?
In this post we are walking through configuring the Prometheus node exporter on a Raspberry Pi. When done, you will be able to export system metrics to Prometheus. Node exporter has over a thousand data points to export. It covers the basics like CPU and memory. But as you will see later, it also goes much further.
I am using Raspbian for this tutorial. However the instructions are generic enough to work on most Linux distributions that use systemd.
I will not cover how to setup Prometheus or complementing tools like Grafana. I am writing additional monitoring focused posts to cover these topics. Stay tuned!
Assumptions:
- Raspberry Pi running Raspbian Linux
- Existing Prometheus server running on another system. It can be on a Pi or another type of system. Alternatively you could try a hosted Prometheus service.
If you want to learn more about Prometheus, I suggest the Prometheus Up & Running book from Oreilly.

About Prometheus and the Node Exporter

Prometheus is an open source metrics database and monitoring system. In a typical architecture the Prometheus server queries targets. This is called “scraping”. Scraping targets are HTTP endpoints on the systems being monitored. Targets publish metrics in the Prometheus metrics format.
Prometheus stores the data collected from endpoints. You can query Prometheus data store monitoring and visualization.
Many systems or stacks do not have Prometheus formatted. For example a Raspberry Pi running Raspbian does not have a Prometheus metrics endpoint. This is where the node exporter comes in. The node exporter is an agent. It exposes your host’s metrics in the format Prometheus expects.
Prometheus scrapes the node exporter and stores the data in its time series database. The data can now be queried directly in Prometheus via the API, UI or other monitoring tools like Grafana.
Node Exporter Setup on Raspberry Pi running Raspbian
Ok, lets dive into the actual setup of the node exporter. You might notice that I am not installing the node importer via a package management tool like “apt”.
This is intentional. The node exporter is updated frequently. As a result packages contained in a package repo often lag releases. Therefor I prefer to install the latest release from the node exporter Github page.
Step 1 Download Node Exporter to Your Pi
In this step we are simply downloading a release of the node exporter. Releases are published on projects releases page on Github. The node exporter release binaries are architecture specific. This means you need to download the ArmV7 build for Raspberry Pi 4. If you are on a Raspberry Pi 3 you will need the ArmV6 build.
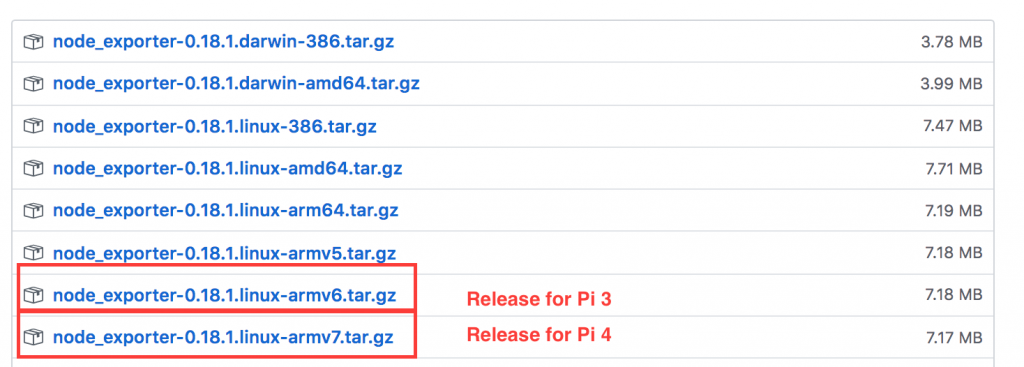
Log into your Raspberry Pi and run the following wget command to download node exporter for the ArmV7 architecture.
wget https://github.com/prometheus/node_exporter/releases/download/v0.18.1/node_exporter-0.18.1.linux-armv7.tar.gzNow un-tar the release using this command.
tar -xvzf node_exporter-0.18.1.linux-armv7.tar.gzThis will un-tar the files into a sub-directory that looks like this.
node_exporter-0.18.1.linux-armv7/
node_exporter-0.18.1.linux-armv7/node_exporter
node_exporter-0.18.1.linux-armv7/NOTICE
node_exporter-0.18.1.linux-armv7/LICENSE
Step 2 – Install node_exporter binary and create required directories
The only file we need out of the expanded tarball is the node_exporter binary. Copy that file to /usr/local/bin.
sudo cp node_exporter-0.18.1.linux-armv6/node_exporter /usr/local/binUse the chmod command to make the node_exporter binary executable.
chmod +x /usr/local/bin/node_exporterCreate a service account for the node_exporter.
sudo useradd -m -s /bin/bash node_exporterMake a directly in /var/lib/ that will be used by the node_exporter. Change the ownership to the service account we just created.
sudo mkdir /var/lib/node_exporter
chown -R node_exporter:node_exporter /var/lib/node_exporter
You have completed the node_exporter binary installation and setup of required directories!
Step 3 – Setup systemd unit file
Next step, setting up the unit file. The unit file will allow us to control the service via the systemctl command. Additionally it will ensure node_exporter starts on boot.
Create a file called node_exporter.service in the /etc/sytemd/system directory. The full path to the file should be:
/etc/systemd/system/node_exporter.servicePut the following contents into the file:
[Unit]
Description=Node Exporter

[Service]
# Provide a text file location for https://github.com/fahlke/raspberrypi_exporter data with the
# --collector.textfile.directory parameter.
ExecStart=/usr/local/bin/node_exporter --collector.textfile.directory /var/lib/node_exporter/textfile_collector

[Install]
WantedBy=multi-user.target
I also have the unit file posted on this github gist.
Now lets reload systemd, enable and start the service.
sudo systemctl daemon-reload
sudo systemctl enable node_exporter.service
sudo systemctl start node_exporter.service
Congratulations the node_exporter service should be running now. You can use the systemctl status node_exporter command to verify.
The output should look like this:
sudo systemctl status node_exporter.service
● node_exporter.service - Node Exporter
   Loaded: loaded (/etc/systemd/system/node_exporter.service; enabled; vendor preset: enabled)
   Active: active (running) since Thu 2020-01-16 18:53:28 GMT; 21s ago
 Main PID: 1740 (node_exporter)
    Tasks: 5 (limit: 4915)
   Memory: 1.2M
   CGroup: /system.slice/node_exporter.service
           └─1740 /usr/local/bin/node_exporter --collector.textfile.directory /var/lib/node_exporter/textfile_collector
Jan 16 18:53:28 raspberrypi node_exporter[1740]: time="2020-01-16T18:53:28Z" level=info msg=" - sockstat" source="node_exporter.go:104"
Jan 16 18:53:28 raspberrypi node_exporter[1740]: time="2020-01-16T18:53:28Z" level=info msg=" - stat" source="node_exporter.go:104"
Jan 16 18:53:28 raspberrypi node_exporter[1740]: time="2020-01-16T18:53:28Z" level=info msg=" - textfile" source="node_exporter.go:104"
Jan 16 18:53:28 raspberrypi node_exporter[1740]: time="2020-01-16T18:53:28Z" level=info msg=" - time" source="node_exporter.go:104"
Jan 16 18:53:28 raspberrypi node_exporter[1740]: time="2020-01-16T18:53:28Z" level=info msg=" - timex" source="node_exporter.go:104"
Jan 16 18:53:28 raspberrypi node_exporter[1740]: time="2020-01-16T18:53:28Z" level=info msg=" - uname" source="node_exporter.go:104"
Jan 16 18:53:28 raspberrypi node_exporter[1740]: time="2020-01-16T18:53:28Z" level=info msg=" - vmstat" source="node_exporter.go:104"
Jan 16 18:53:28 raspberrypi node_exporter[1740]: time="2020-01-16T18:53:28Z" level=info msg=" - xfs" source="node_exporter.go:104"
Jan 16 18:53:28 raspberrypi node_exporter[1740]: time="2020-01-16T18:53:28Z" level=info msg=" - zfs" source="node_exporter.go:104"
Jan 16 18:53:28 raspberrypi node_exporter[1740]: time="2020-01-16T18:53:28Z" level=info msg="Listening on :9100" source="node_exporter.go:1“Listening on :9100” is the key piece of information. It tells us that node_exporter web server is up on port 9100. Try using wget or curl to query the node_exporter.
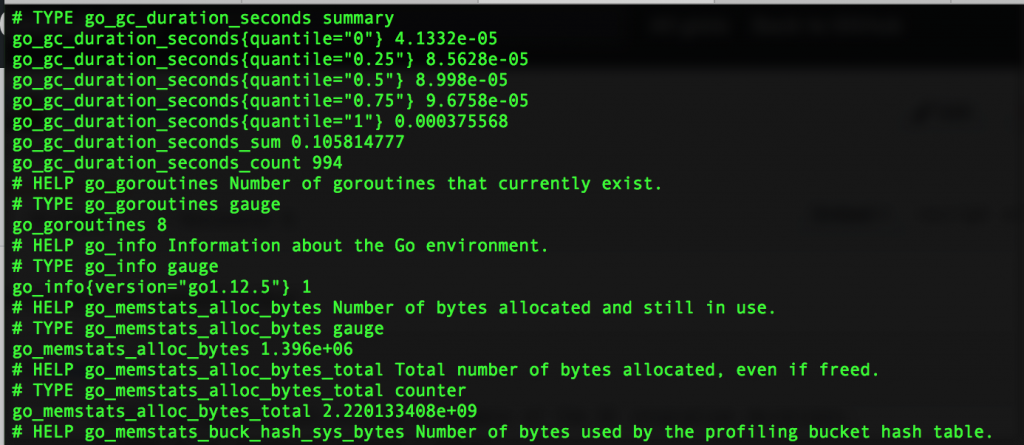
curl http://localhost:9100/metricsThe output should look similar to this. Additionally I have an example of my Raspberry Pi’s output on this github gist.
Next steps
Now you should add the metrics endpoint as a target to your Prometheus server. You can do this by editing the prometheus configuration file on your prometheus server. For reference mine looks like this.
# my global config
global:
  scrape_interval:     15s # Set the scrape interval to every 15 seconds. Default is every 1 minute.
  evaluation_interval: 15s # Evaluate rules every 15 seconds. The default is every 1 minute.
  # scrape_timeout is set to the global default (10s).

# Alertmanager configuration
alerting:
  alertmanagers:
  - static_configs:
    - targets:
      # - alertmanager:9093

# Load rules once and periodically evaluate them according to the global 'evaluation_interval'.
rule_files:
  # - "first_rules.yml"
  # - "second_rules.yml"

# A scrape configuration containing exactly one endpoint to scrape:
# Here it's Prometheus itself.
scrape_configs:
  # The job name is added as a label `job=<job_name>` to any timeseries scraped from this config.
  - job_name: 'prometheus'

    # metrics_path defaults to '/metrics'
    # scheme defaults to 'http'.

    static_configs:
    - targets: ['localhost:9090']

  - job_name: 'pi1'
    scrape_interval: 5s
    static_configs:
    - targets: ['10.1.100.2:9100']
This is the standard prometheus config file. However I added the following target at the end for my Raspberry Pi:
- job_name: 'pi1'
    scrape_interval: 5s
    static_configs:
    - targets: ['10.1.100.2:9100']
The IP address of my Raspberry Pi is 10.1.100.2. The Port 9100 corresponds is the port used by node_exporter.
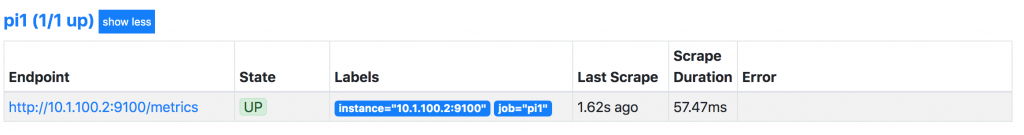
I restart my Prometheus server and the target is now displayed in Prometheus.
If you are using Prometheus, you are likely using Grafana as well. Grafana has an excellent node_exporter dashboard template available.
Which Tutorial Should I do Next?
Clearly Node Exporter is just one piece of the puzzle. Given that, I will be writing some tutorials on Prometheus, Grafana and other monitoring subjects. Vote for which I should do next by leaving a comment. Thanks!
Conclusion
Node Exporter is a powerful tool for getting metrics out of your Raspberry Pi. However there are some downsides. The main downside is the requirement of a Prometheus server. I use Prometheus already so it was a no-brainer for me.
Prometheus can be setup to run a Raspberry Pi. However I typically advise against it. Prometheus does a big job and the Pi is not well suited for any but the smallest Prometheus workloads.
Links and Reference
- Prometheus
- Prometheus Node Exporter
- Raspbian Linux
- Systemd Unit File in Github gist
- node_exporter query output
- Grafana
- Grafana node exporter dashboard
Thank your for this tutorial
Great tutorial, thank you!
I installed prometheus + node_exporter + grafana on a RPi 4B which already runs openhab2 + influxdb + mosquitto + broadlink-mqtt + py-kms.
I currently have 4 machines being monitored (the pi4 itself, another pi3b running octoprint, a tp-link 1043nd router running openwrt and a NSA325-v2 Zyxel NAS running ffp) and the average CPU load is only 6% !
I can confirm prometheus works flawlessly on a RPi4b together with other apps.
Prometheus and Grafana tutorials would be great, I found this easy to follow along.
Thanks for the feedback Jeff. I will try to get a few done in the next month or so.
I have tried to install this a number of times and I get to the “systemctl status node_exporter” and keep getting “caller=textfile.go:197 collector=textfile msg=”failed to read textile collector”
Is there any chance you could offer a suggestion, please.
System is Raspberry Pi 4 Linux 10 (Buster) ID:Raspian ID:Debian
Duncan, at a bare minimum you could remove the “–collector.textfile.directory /var/lib/node_exporter/textfile_collector” from the systemd.unit and see if it starts, I expect it will. Next I would check to make sure that the directory exists, permissions and good and reintroduce the flag. It is used for dumping stats from scheduled tasks or monitoring that you don’t want to run constantly. Like running “du” to check directory or file system space consumption.